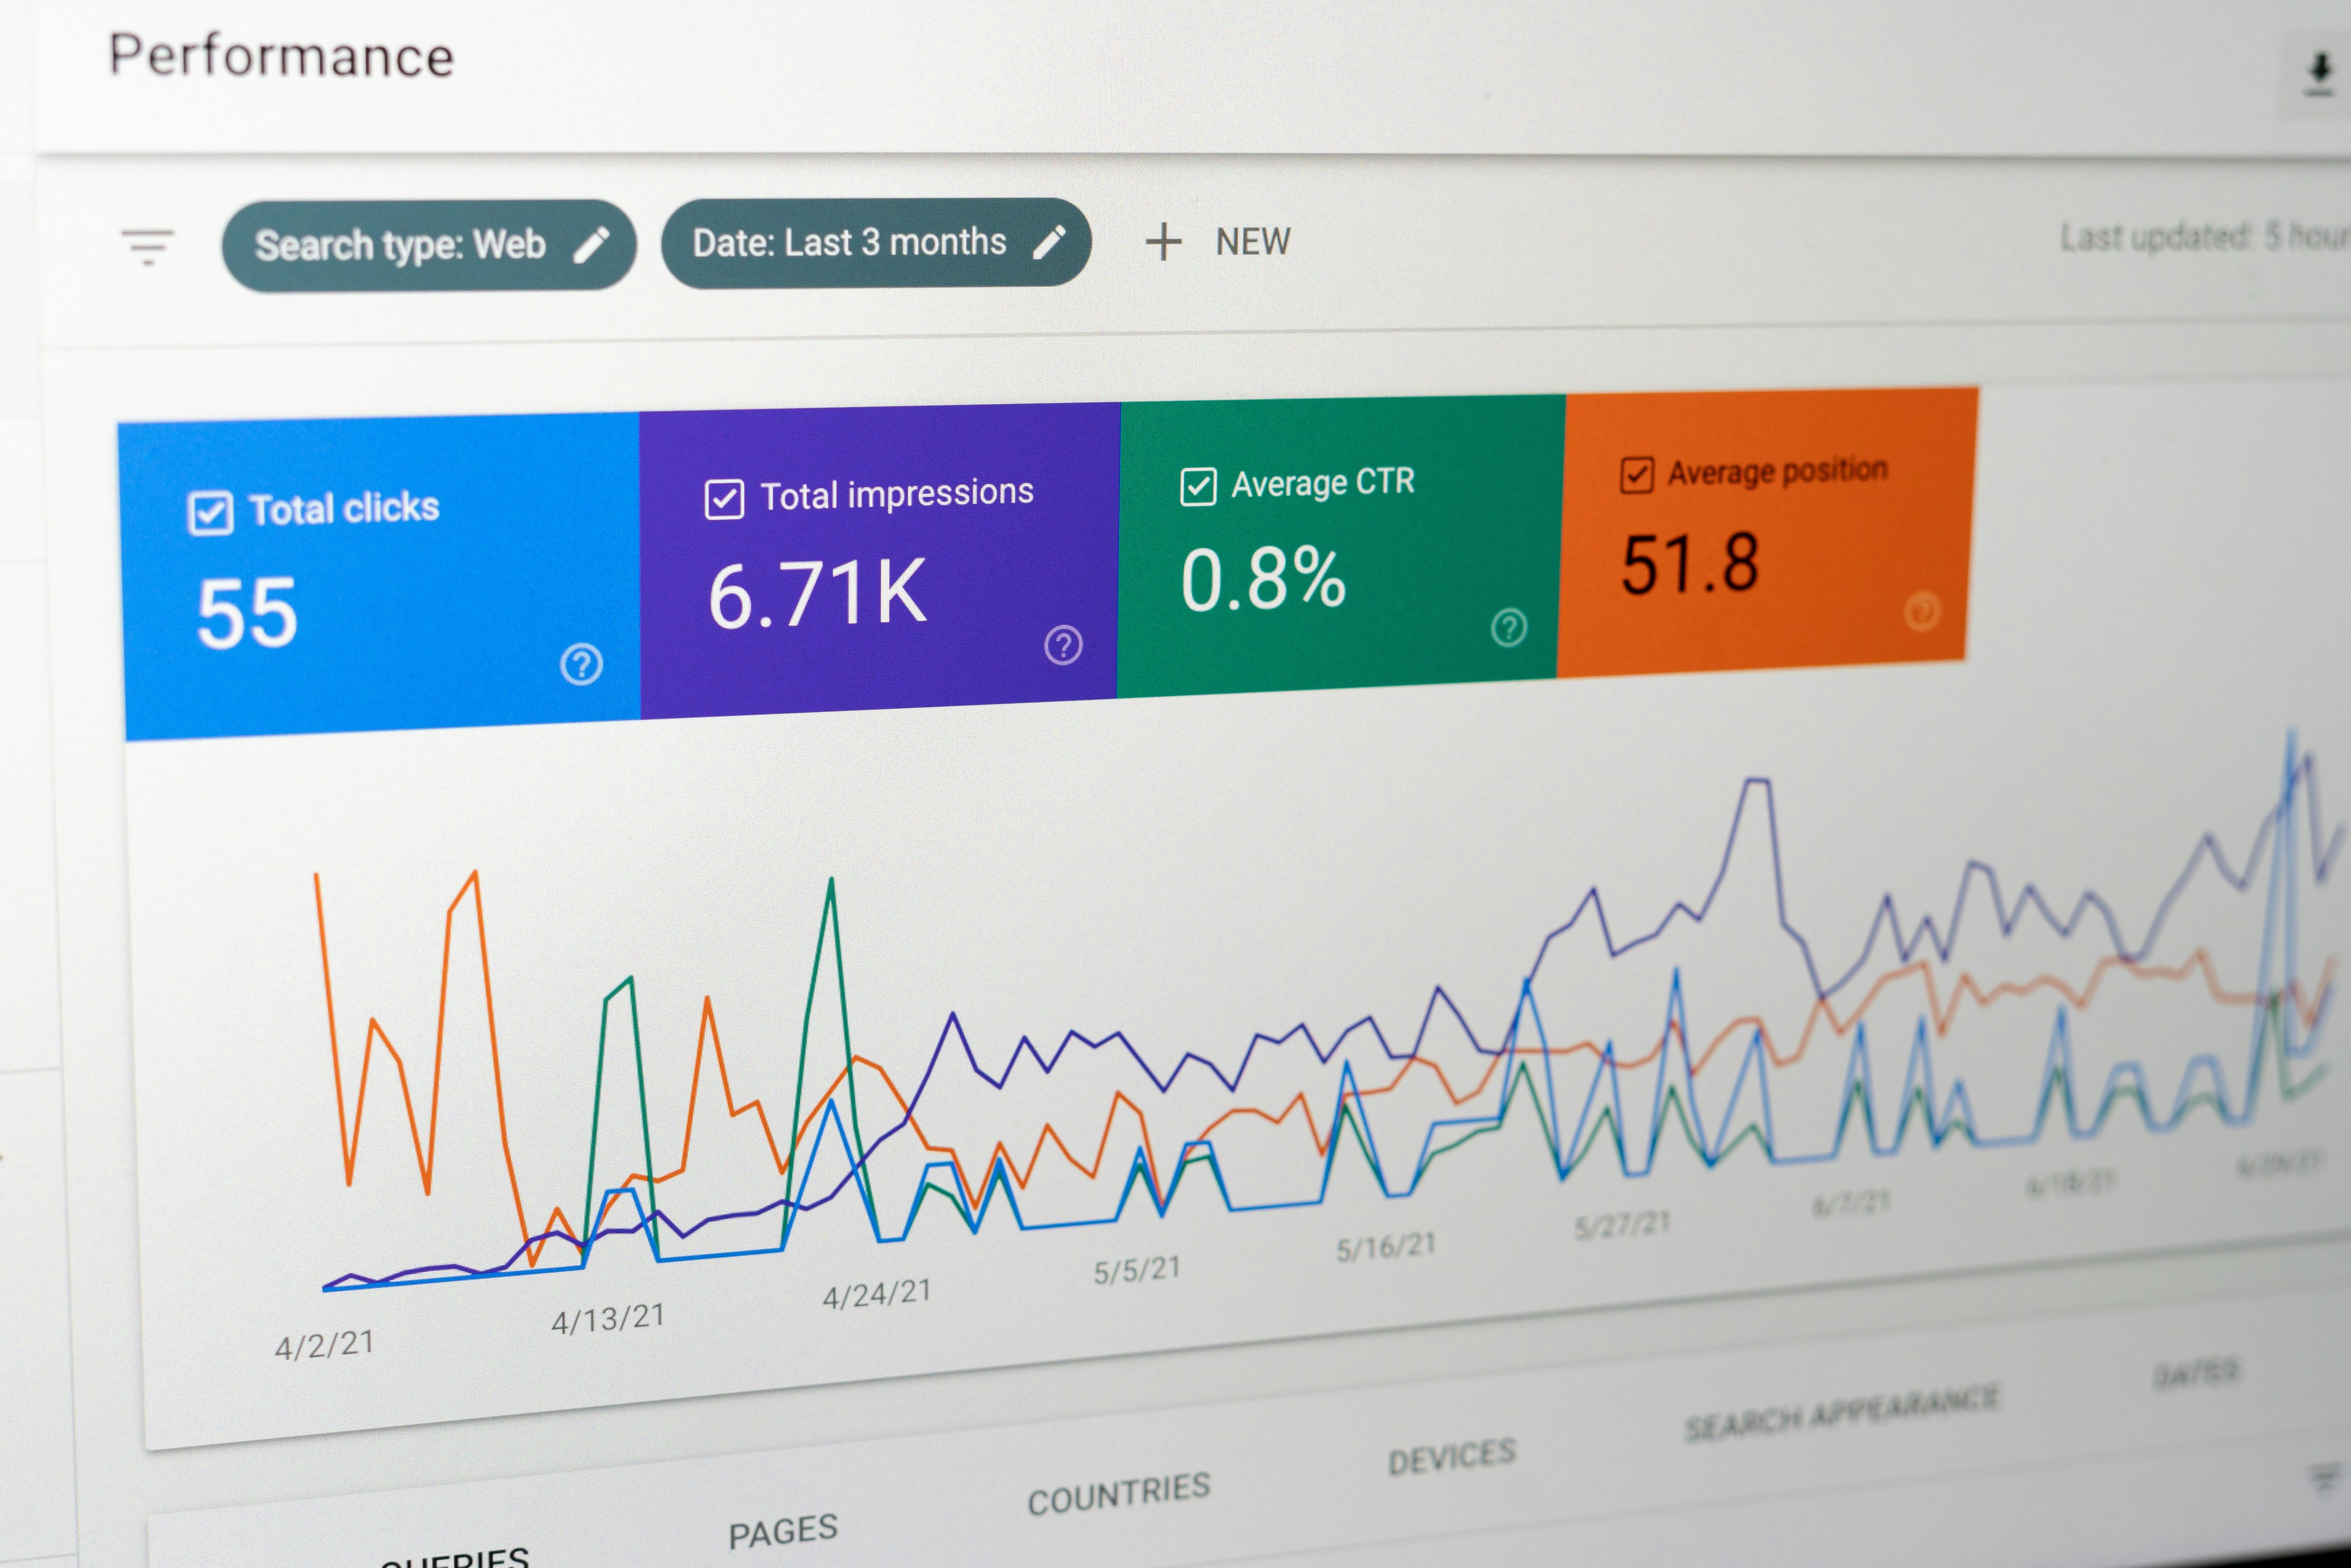
Google first launched Google Analytics late in 2005. Since that time, Google Analytics has had a huge impact on marketing. Over the years, marketers, web developers, and analysts relied on Google analytics to track and analyze website traffic, user behavior, and other metrics. The information was used to improve the performance of websites and optimize marketing campaigns.
Between 2005 and 2023, Google Analytics went through several major version updates. Numerous updates and enhancements were made to each version through the years. In the summer of 2023, Google Analytics deprecated their previous analytics, Universal Analytics (UA), and replaced this with GA4. This has been a large shift that has required everyone to adapt to the new system.
Why The Change to GA4?
Google attempted to address privacy concerns with the release of GA4. GA4 includes privacy controls. Data is now event-based rather than session-based. Google states changes such as collecting website and app data and reporting events allow marketers to better understand the customer journey while remaining compliant with the evolving user privacy standards across the world.
What Has Changed?
GA4 measures events rather than sessions and pageviews. This changes how the metrics are defined, analyzed, and interpreted. This can trigger a cascade of required changes in organizations that have structured their marketing on the foundation of Google Analytics. Multiple key performance indicators and measurement strategies have been updated. For example, the bounce rate in UA was a percentage of single-page sessions. GA4 has moved to a bounce rate defined as the inverse of the engaged session rate, or engagement rate.
How Have Google Analytics Users Adapted to the Change?
Shortly after Google released GA4, Google Analytics users had a list of complaints. The GA4 user interface was considered cumbersome, and the platform still lacks documentation and educational resources. GA4 was found by users to be more confusing than the previous Universal Analytics (UA). UA generated a range of reports while GA4 is much more limited by default. Users attempting to recreate the reports they received with UA found this difficult if not impossible given the change in data structure. To fill the gap left created by GA4 users are forced to create custom reports for analytics questions that were previously answered with ease using UA. Further, creating reports in GA4 has not been as straightforward as it previously was resulting in a steep learning curve and the frustration of many users.
There have been areas of improvement as well. Some users find GA4 more streamlined and customizable. The focus on engaged sessions and event-based reporting can be seen as a more accurate way to determine performance but requires an understanding of how specific events are defined rather than a simple industry standard definition of a pageview.
Google Analytics Weaknesses
In addition to the recent changes to Google Analytics potentially compromising ongoing campaigns and marketing workflows, there are additional drawbacks to using Google Analytics which have always been a factor.
Google Analytics is limited to client-side tracking engagement on user browsers as a third-party tracking service. That said, users with specific privacy settings and/or Ad Blockers on their browser/device will be invisible to Google Analytics tracking. Due to the browser-based tracking limitation, the data from Google is not exact and is missing some visitors entirely (ranges from 5-20% of engagement on average depending on your user base). To combat this limitation, Google estimates certain key performance indicators such as active users using projections and industry trends that are not specific to your business. Lastly, third-party tracking services seldom provide robust and detailed information about engaged users over time preventing you from developing a clear picture of exactly who is engaging when.
Google Analytics is a great tool for understanding general trends in site engagement and real-time site health statistics, but it does not give clear insight into who was doing what. This makes it useful for determining your website health and directional real-time analytics, but it is a supplemental tool, and building product manufacturers need more reliable data sources to serve as a source of truth for behavioral analytics and actionable performance reporting.
Analytics for Building Product Manufacturers
CADdetails offers building product manufacturers detailed analytics to help understand how CADdetails and Design Hub users interact with building and landscape product content. CADdetails analytics capture the intent of architects and design professionals and provide unique insights into the design community.
CADdetails tracking captures more detailed information than your standard third-party tracking service, like GA4, because it relies on both browser and server-based (aka server-side) tracking. In contrast, to Google Analytics, the addition of server-side tracking means that all users who engage with the website are accurately tracked. As a dedicated analytics resource to building product manufacturers, CADdetails has robust bot mitigation, data validation, and quality assurance strategies leveraged against our tracked engagement providing a more accurate representation of the data than Google Analytics. We are dedicated to continuously improving our approach to data hygiene to ensuring it reflects industry best practices and produces high-quality results.
CADdetails tracks a wider variety of engagement events. Our system not only tracks when users are active but also what they're doing when they're active with more detail than what you see in Google Analytics. The entire user journey can be tracked on CADdetails including what pages users travel to, what they search, what content they click on, and what content they download.
Are you a building product manufacturer interested in gaining insight into how the design community interacts with your product information and design files while also gaining exposure to over 680,000 design professionals seeking product information? Book a call with CADdetails to learn how our analytics program can help!
Cover image by Justin Morgan on Unsplash


-1.png)