
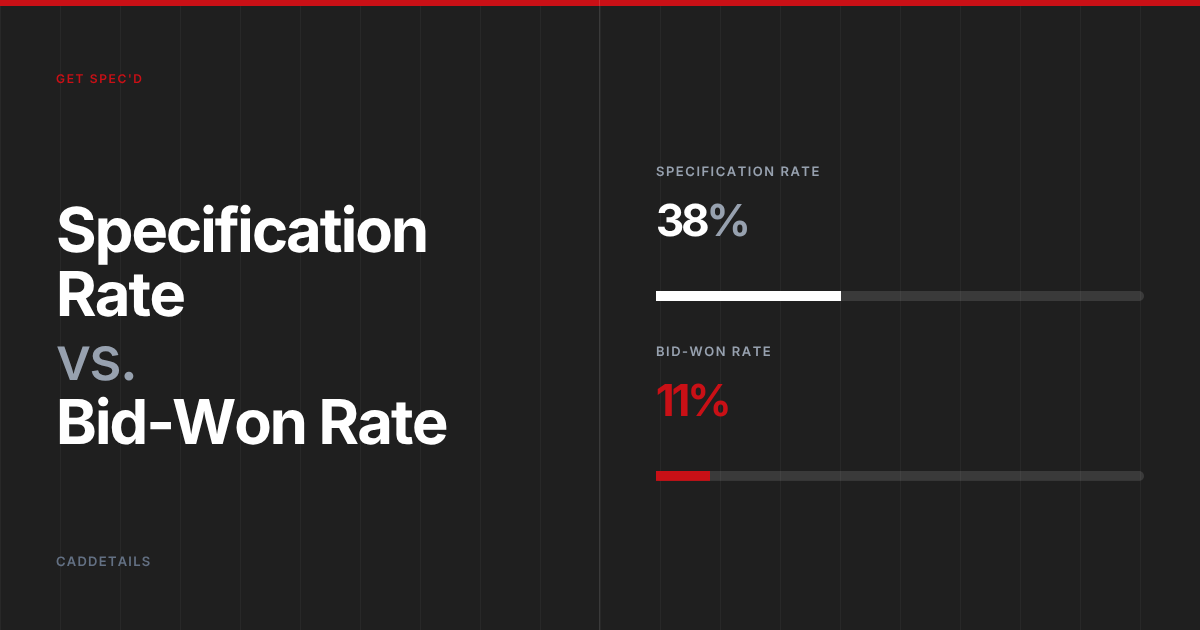
Most building product manufacturers can tell you how many leads they got last quarter. Far fewer can tell you how many of those leads turned into a specification, and even fewer can tell you how many specified projects actually got built with their product in it.
That gap matters. If you're only tracking top-of-funnel activity like downloads, page views, or sales calls, you're flying blind on the two metrics that actually predict revenue: your specification rate and your bid-won rate.
Why These Metrics Matter
Every specifier who searches for a product like yours is a potential data point. But a search isn't a sale, and even a specification isn't a sale. Between "an architect looked at my product" and "my product is installed in a building," there are two conversion steps, and most manufacturers only ever measure the first one, if that.
Here's the problem with that blind spot: marketing spend, content investment, and sales time all get allocated based on gut feel instead of data. You might be pouring resources into generating more top-of-funnel interest when your real bottleneck is actually holding your spec through the bidding process. Or the opposite—your bid-won rate might be excellent, and what you actually need is more qualified opportunities entering the funnel in the first place.
Without measuring both rates, you can't tell which problem you have. And you can't fix a problem you can't see.
What Is Specification Rate?
Your specification rate is the share of qualified opportunities (specifiers actively evaluating products in your category) that end with your product written into the spec.
Here's the basic formula:
Specification Rate = (Number of projects where your product was specified ÷ Number of qualified opportunities or searches) × 100
For example, if 4,000 design professionals search for products in your category every month, that's 48,000 searches a year. If only 2% of those searches turn into serious consideration of your product, that's 960 real opportunities. If 10% of those result in an actual specification, that's 96 specified projects a year.
That 96 is your specification rate in action, and it's the number that determines how many projects even have a chance of using your product.
What Is Bid-Won Rate?
Getting specified is a milestone, not the finish line. A spec can still get value-engineered out, swapped for a competitor, or lost during the bidding and construction process. Your bid-won rate tells you how often a specification survives all the way to an actual installed, built, invoiced project.
Here's the basic formula:
Bid-Won Rate = (Number of specified projects that were ultimately built with your product ÷ Number of times your product was specified) × 100
If you were specified on 96 projects last year but only 60 of those actually broke ground with your product still in place, your bid-won rate is 62.5%. That's the number that tells you how well your team defends a spec once it's won — through technical support, relationship management with contractors, and staying visible through the bidding phase.
Where to Find These Numbers in Your Own Systems
You likely already have most of this data — it's just scattered across a few different tools instead of living in one place.
For specification rate, look at:
- Spec-tracking and plan room platforms like Dodge Construction Network, ConstructConnect, Masterspec, SpecLink, or e-SPECS — these track when and where your product actually appears in a written spec, often broken out by project, region, and architect.
- CADdetails / Design Hub analytics — downloads, views, and content engagement on your product listings are leading indicators of specification activity, and can be cross-referenced against confirmed specs.
- Your CRM (Salesforce, HubSpot, etc.) — if your sales and marketing teams log architect meetings, submittals, and "specified" status changes on opportunities, this is often your fastest source for a rough specification count.
- Rep and distributor field reports — many manufacturers still rely on sales reps to manually flag when they learn a project has specified their product. It's less automated, but it's real data if it's being logged consistently.
For bid-won rate, look at:
- Order and shipment data in your ERP — the clearest confirmation that a specified project actually resulted in a sale is a purchase order or shipment tied back to that project.
- Win/loss reports from your sales and estimating teams — most sales teams already track which bids they won or lost; the missing link is tagging those outcomes back to whether the project was originally specified with your product.
- Distributor and contractor relationships — since specs can get value-engineered out between design and construction, your distributors and installing contractors are often the first to know when a substitution happens.
- Project close-out or as-built records, where available — these confirm what actually got installed, which is the ultimate source of truth for bid-won rate.
If this data currently lives in four different spreadsheets and nobody owns pulling it together, that's normal, but it's also exactly why so few manufacturers can answer these two questions with confidence.
What Good Looks Like: Benchmarks to Compare Against
Specification rate and bid-won rate vary significantly by product category, price point, and project type, so treat any benchmark as a directional guide rather than a hard target. That said, a few general patterns show up consistently across the building products industry:
- Specification rate for a well-positioned product in a competitive category (with strong content, visibility, and specifier relationships) often lands somewhere in the 8–15% range of qualified opportunities or serious product consideration. Categories with fewer viable competitors, or highly specialized/technical products, can see meaningfully higher rates, while commodity categories with many substitutes tend to run lower.
- Bid-won rate commonly falls in the 50–70% range for manufacturers with solid contractor relationships and consistent technical support through construction. Rates below that often point to value engineering or substitution problems, while rates above that usually reflect strong distributor relationships or products with few equivalent substitutes.
The honest answer is that your own historical performance is a better benchmark than any industry-wide number. The goal isn't to hit someone else's percentage; it's to know your own baseline well enough to see when it moves, and why.
Why You Need Both Numbers, Not Just One
A strong specification rate with a weak bid-won rate tells a very different story than the reverse, and each one points to a different fix:
- High specification rate, low bid-won rate: Your marketing and content are working; architects want your product. The leak is happening later, likely during value engineering or bidding, where you're losing ground to substitutions. The fix is usually stronger contractor relationships, more competitive pricing support, or better documentation that makes it harder to swap you out.
- Low specification rate, high bid-won rate: Once you're in a spec, you tend to stay in it. But you're not getting into enough specs in the first place. The fix is visibility; more product listings, better technical content, stronger presence where specifiers are actually searching.
- Both low: You have a pipeline problem at every stage, and it's worth auditing the entire journey from search to installed project.
Without tracking both, it's easy to misdiagnose which stage of the funnel is actually leaking revenue and to spend money solving the wrong problem.
Put Real Numbers Behind It
These formulas are simple on paper, but the real value comes from plugging in your own numbers—your category's search volume, your current conversion assumptions, your average project value—and seeing what your pipeline actually looks like today versus what it could look like if you improved either rate by even a few percentage points.
That's exactly what the CADdetails Pipeline Builder is built to do. It's a free ROI calculator that helps you model your own specification rate and bid-won rate, see where your pipeline is leaking revenue, and estimate the impact of closing those gaps, whether that means increasing visibility earlier in the design process or strengthening your position through bidding.
Guessing at these numbers costs money. Knowing them tells you exactly where to focus next.